Data science is young and interdisciplinary
While the term ‘data science’ was first used decades ago, the field is relatively young. Most academic data science centers are less than ten years old, many starting in 2014 plus or minus a couple years. Because it’s a new field and because data science is changing the way decisions are made across industries, we wanted to know who is making these decisions. What disciplinary backgrounds are involved in data science research and which are dominant? Are the faculty, postdocs, and research staff in data science centers reflective of the gender and racial demographics of the overall university system? Do the demographics look more like computer science? Or are they altogether different? After all, the field is relatively new so there is a possibility that the field will have novel demographic patterns, ones that are not beholden to the long duration of tenure-based turnover.
Discipline by discipline – Who is at the data science table?
We fully expected the data science ‘usual suspect’ fields of computer science, stats, math, engineering, and physics to have the largest membership. It surprised us that the social sciences (and humanities) came in second, though we should note that they were virtually tied with the natural sciences (especially if we had taken the small number of humanities scholars out of the social science + humanities bucket). The professions – business, medicine, and law – were more weakly represented. Business and economics held their own at 8% overall, but medical and legal professionals are scarce. This was also a surprise because there are so many applications of data science currently changing the fields of medicine (e.g. algorithmic radiology) and the law (e.g. ediscovery).

The data science usual suspects of computer science, math, stats, engineering, and physics make up 54% of the overall research data science population and are represented in every single data science research institute. Some institutes only have members from computer science, math, stats, engineering, and physics. These are still interdisciplinary centers, but they bring together adjacent disciplines which is different than centers with a membership that incorporates more disciplines.
The social sciences and humanities as well as the natural sciences have meaningful presence in most data science centers. In hiring contexts, recruiters may have a hard time understanding why a political science or neuroscience degree is relevant. These data suggest that there’s a great deal of talent in people who hold PhDs in these fields with strong math, programming, and/or stats backgrounds.
Disciplinary details: The sciences are contenders
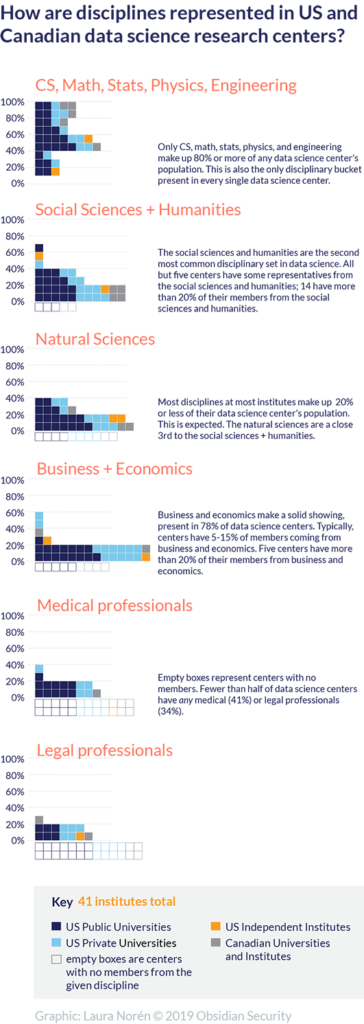
The data science usual suspects of computer science, math, stats, and engineering are the only disciplines represented in every single data science center. Some centers only include the data science usual suspects, another sign of the dominance of this collection of fields. The fact that the usual suspects were strong was not surprising – that’s why they are the usual suspects – but the lack of strong modality in this bucket did surprise us.
The social sciences and humanities came in at second place (17% overall) in a virtual tie with the natural sciences (16%). We were somewhat surprised how evenly matched these fields are overall because within specific institutions, one is often much larger than the other. Five institutions have no social sciences and ten have no natural sciences. Again, the overall figures belie a great deal of divergence from one institution to the next.
From a recruiting perspective, we hope that the perceived shortage of data scientists may be alleviated by recognizing that social scientists and natural scientists are also ready to take on roles as data scientists.
The professional fields presented perhaps the largest puzzle. Business, medicine, and law are all fields facing significant transformation due to applications of data science including machine learning. The application of image recognition applications in radiology has been one of the biggest success stories for data science. The use of text analysis and natural language processing in legal ediscovery tools has also had a dramatic impact on the practice of law. A vast portion of the business of the internet runs on advertisements, marketing tools, and other applications dependent on data science. Yet these are the fields least well-represented in the membership of data science centers.
A majority of data science centers have no members from the field of medicine. Only a third of the data science research centers have even a single member with a law degree. Business is the most well-represented of the three professions, with presence in 78% of data science centers. Still, the size of that representation rarely rises over 20% and is most often in the single digits.
One reason the legal and medical fields are under-represented in centers for data science may be that some universities do not have medical schools or law schools. Those that do, may operate their medical and law schools as completely separate entities, sharing little more than brand image with the larger university. This structural reality may inhibit collaboration. More research is required to understand why law, medicine, and to some degree business, are not better represented in data science research.
Diversity of disciplines does not lead to demographic diversity
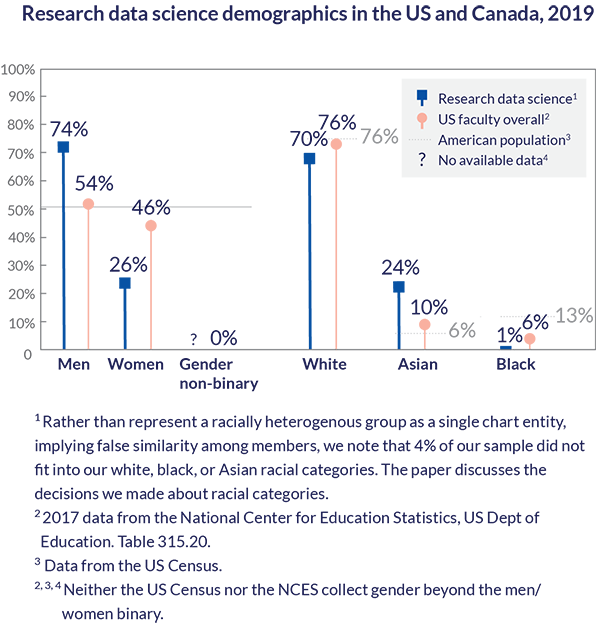
Does having all of these disciplines – disciplines like the social and natural sciences that show greater demographic diversity – translate into more demographic diversity in data science? When it comes to gender diversity, the answer is not much.
Women make up only 26% of the research data science membership. For comparison, they make up 46% of the overall US professoriate and 51% of the adult population. Twenty-six percent is higher than the 14% of women who publish at the top machine learning conferences NeurIPS, ICLR, and ICML (Mantha, Hudson, Simonite 2018), though their research model may have under-counted women.
We felt it was important to consider non-binary genders. In our sample, we found nobody using non-binary pronouns in their professional profiles. We know this is an under-representation of the proportion of research data scientists, but since neither the US federal government nor the National Center for Education Statistics gathers gender data beyond the men/women binary, we are not sure how under-represented this group may be.
As for racial representation, blacks are significantly under-represented in data science at only 1% of overall membership compared with 6% of the US professoriate and 13% of the US population (Canada does not report racial categories the same way the US does). We found that many institutes had a token black member; several had none at all. White members are slightly under-represented at 70% compared to their 76% of the US population and US professoriate. The over-represented racial group in data science is the group labeled Asian, at 24% of overall data science center membership compared to 10% of the US professoriate and 6% of the US population. We hesitated to use “Asian” as a category due to the wide diversity of cultures, languages, and sociopolitical histories lumped awkwardly (possibly offensively) in this category. We considered using national origins as being more descriptive, especially for some Asian countries. However, scholars from China are facing extreme political pressure at the moment. We didn’t want to create a dataset that could be used to increase political pressure on these scholars. We urge caution when using or interpreting the category we refer to here as ‘Asian’.
How does your institute stack up? click for full pdf
If you’d like to see how your institute compares to others, click through for a graphic that visualizes all disciplinary and demographic data for each of the 41 institutes in our sample. The full version is available as a pdf. We have included a preview of disciplinary data for select institutes here.
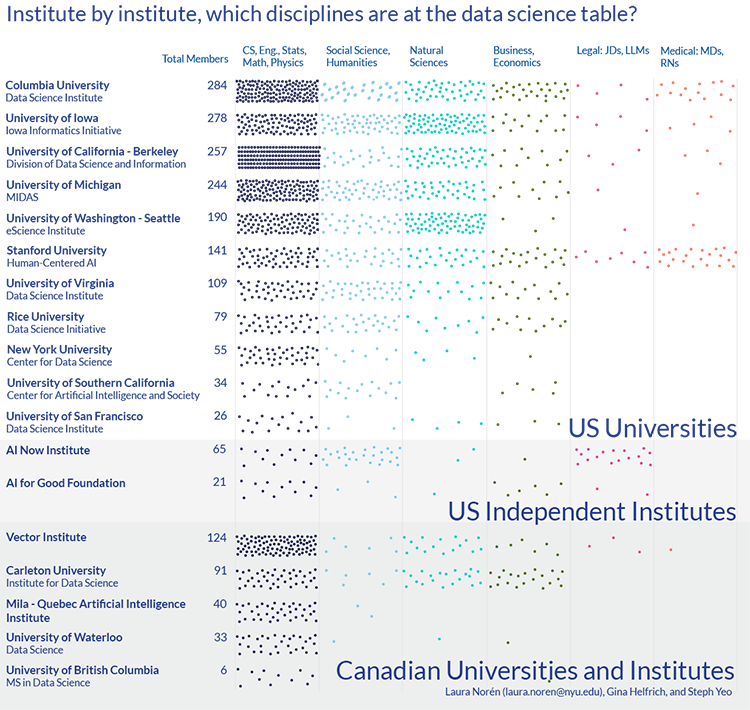
Canadian institutes are less dedicated to the broad interdisciplinarity demonstrated by the US universities. There was no major difference between public and private schools. There were too few independent institutes in our sample to draw conclusions, but we would note that only AI Now Institute had more than 50% women at the time of data collection. Stanford’s Human-Centered AI group, after receiving a dubious reception earlier this spring due to low numbers of black scholars and women, is actually roughly on par with research data science averages for gender and race, but has significant disciplinary diversity. This is not a defense of the under-representation of women, gender non-binary, or scholars from under-represented racial groups, but a chance to provide broader context. Stanford is not unique in terms of its center’s demographics, but it is a leader when it comes to building a radically interdisciplinary center in which no discipline constitutes more than 40% of the membership.
Conclusion
As a young field, we hope to see newly forming data science research centers use this data to benchmark their hiring and retention efforts. Additionally, we hope that industry-based data science team-builders will expand their pipelines to include the full range of disciplines currently participating in research data science, especially social scientists and natural scientists.
This research is the first to take a cross-national perspective that examines who is included in research data science in detail. Both disciplinary and demographic diversity matter. One cannot substitute for the other.
Appendix
Sample
In June 2019 we gathered data from ~3300 individuals at 41 research centers focusing primarily on data science and/or artificial intelligence in the US and Canada. We wanted to include more institutes. Seven US institutes opted out and we decided not to include UK schools at the moment.
Methods
We gathered the data manually mostly from institutional websites with the occasional assist from a person’s standalone website (e.g. mylabwebsite.com) and LinkedIn public profiles. No web scraping tools were used. Each institute was given a chance to review and correct the data we found; seven took this opportunity to opt-out of the study. The field in which a person obtained their highest degree was used to categorize their disciplinary background. Overachievers with two terminal degrees – a JD and a PhD or an MD/PhD – were categorized as having two highest degrees, representing two distinct fields.
Ethics
We sought institutional review board (IRB) approval from NYU’s IRB. They deemed the study to fall short of research with humans because all of the data we obtained were in the public realm. Still, we wanted to be sure we were following all laws and guidelines for research ethics and pursued further review with NYU’s research data compliance officers. The project meets all current guidelines for ethical treatment for human research subjects and data subjects in North America.