A Look Inside: SaaS Security Workflows that Scale
How one team leverages Obsidian APIs to automate operations, drive ownership, and deliver on what matters most.
Note from Obsidian Security:
At Obsidian, we’re lucky to work with incredible security teams who are tackling SaaS challenges head-on and building innovative programs to make security smarter. Gabe Bello’s security team is one such example. They’ve leveraged Obsidian Security APIs to create smarter, more efficient workflows that strengthen their SaaS security program—an approach that other organizations can look to as a model.
In this blog post, Gabe shares the workflows and programs his team has built, and how they’re raising the bar for what modern SaaS security can look like.
Introduction
Security teams everywhere are lean, yet we balance an ever-growing list of responsibilities. For my Information Security team, SaaS is right at the top of that list. We see that some of the biggest industry threats are increasingly tied to SaaS applications and know we must proactively address SaaS risks.
Our partnership with Obsidian marked the beginning of new visibility and control into our SaaS environment. With a clear view of our SaaS posture for the first time, our team could go beyond policies and standards on paper and see how people were actually working.
With Obsidian, we’re building out a SaaS security program with two major philosophies:
1. Secure our company’s SaaS landscape at scale
2. Empower app owners to move with agility and remediate risks self-service
By leveraging Obsidian’s APIs, we’ve turned that philosophy into scalable workflows that strengthen SaaS security. Here’s what we’ve built:
1. Support for Internal Security OKRs
The Challenge
Security teams need to prove value and demonstrate trends, but tracking progress across all apps is complex and time-consuming. Obsidian’s UI dashboards provide a high-level overview, but reporting progress on internal OKRs requires customizability that may change quarter over quarter. Since our team also has multiple workstreams leveraging the Obsidian product, we need to be able to isolate specific data points for each OKR.
The Solution
Analyze data pulled from Obsidian through APIs to organize information for security leadership and identify areas of acceleration and blocked work.
The Workflow
One of our hardest problems was reporting progress against internal security OKRs. Leadership needed high-level trends, while engineers needed detailed drill-downs. Doing this manually across dozens of apps didn’t scale.
Using Obsidian’s REST APIs, we now fetch:
- All tenant rules (List Tenant Rules)
- All tenant settings (List Tenant Settings)
- Update tenant rule tags
- Update tenant setting tags
From there, our workflow does the heavy lifting — aggregating passing/failing policies, surfacing breakdowns by tenant, and flagging blocked tenants where progress has stalled. Passing and failing policies are what we see in Obsidian, whereas blocked policies are an identifier we use internally to describe OKR-related progress (e.g. a team is over capacity and cannot support risk burndown this sprint).

We have two main views: one for executive leadership and one for the engineering team.
Executive metrics look like this:
1. Aggregated count of passing, failing, and blocked policies (raw count and percentages). This can be filtered to which tenants we’ve scoped for risk burndown.
2. A diff summary of policies that drifted (failing → passing, passing → failing) to highlight key wins and challenges since the last update.
Engineering metrics look like this:
1. Tenant-level breakdown of passing, failing, and blocked policies. This is filtered similarly to our executive metrics, only surfacing tenants we are actively working on for risk reduction.
2. A detailed diff report on policies and their changes: state change (pass/fail/blocked) and violation count change (highlights progress towards state change, especially for high-violation policies).
We run these reports at least biweekly (in sync with our OKR and engineering updates) and can also be triggered on demand. Each update shows the delta since the last cycle to show trends over time.
The Results
- Clear metrics for leadership, showing progress and trends
- Actionable drill-downs for engineering
- Minimal manual effort
2. Automating Operations
The Challenge
In the early days of our SSPM program, remediation was slow and manual. Security engineers ran what we called a “white-glove service” — personally triaging violations, chasing app owners, and revisiting policies. With no SLAs, no escalation paths, and no accountability outside the security team, we couldn’t consistently drive towards our risk targets.
The Solution
We built a lightweight automation framework on top of Obsidian’s webhook capabilities to make risk reduction into backlog-able work:
- Enriching risks with company-centric data: Risks are shipped out exclusively via webhook, and we contextualize the risk with company-specific context (risk ownership, accountable executive, severity mapping to standardized naming conventions). This manifests as a single ticket, assigned to the risk owner.
- Noise reduction: Only vetted rules cut tickets; app owners see actionable issues that have already been reviewed and tuned for accuracy.
- Automated ticket closure: When a policy flips from Failing → Passing, an additional webhook fires to close the related Jira ticket. Since we already tuned the rule for accuracy, we’ve verified the acceptance criteria for remediation and can close tickets with zero security engineering intervention.
This transformed operations. Tickets are created with the right context, routed to the right owners, and closed automatically. Risks don’t languish in the console, and engineers can focus on higher-impact work.
The Workflow
Webhooks for Jira Integration
We chose Action Policy → Webhook for extensibility. Native Atlassian integrations don’t handle our custom Jira fields well, and we can route the webhook to an internal service where we can hydrate the payload:
- Service ownership: Who owns this service?
- Accountability: Which executive is responsible?
- Severity mapping: How does this tie into internal SLAs?
- Tag filtering: Have we verified this rule should create a ticket?
Before introducing automation, we took time to vet each rule so that we could trust the data feeding this flow. Because of that upfront work, we’re confident letting Obsidian automatically close tickets when issues remediate.
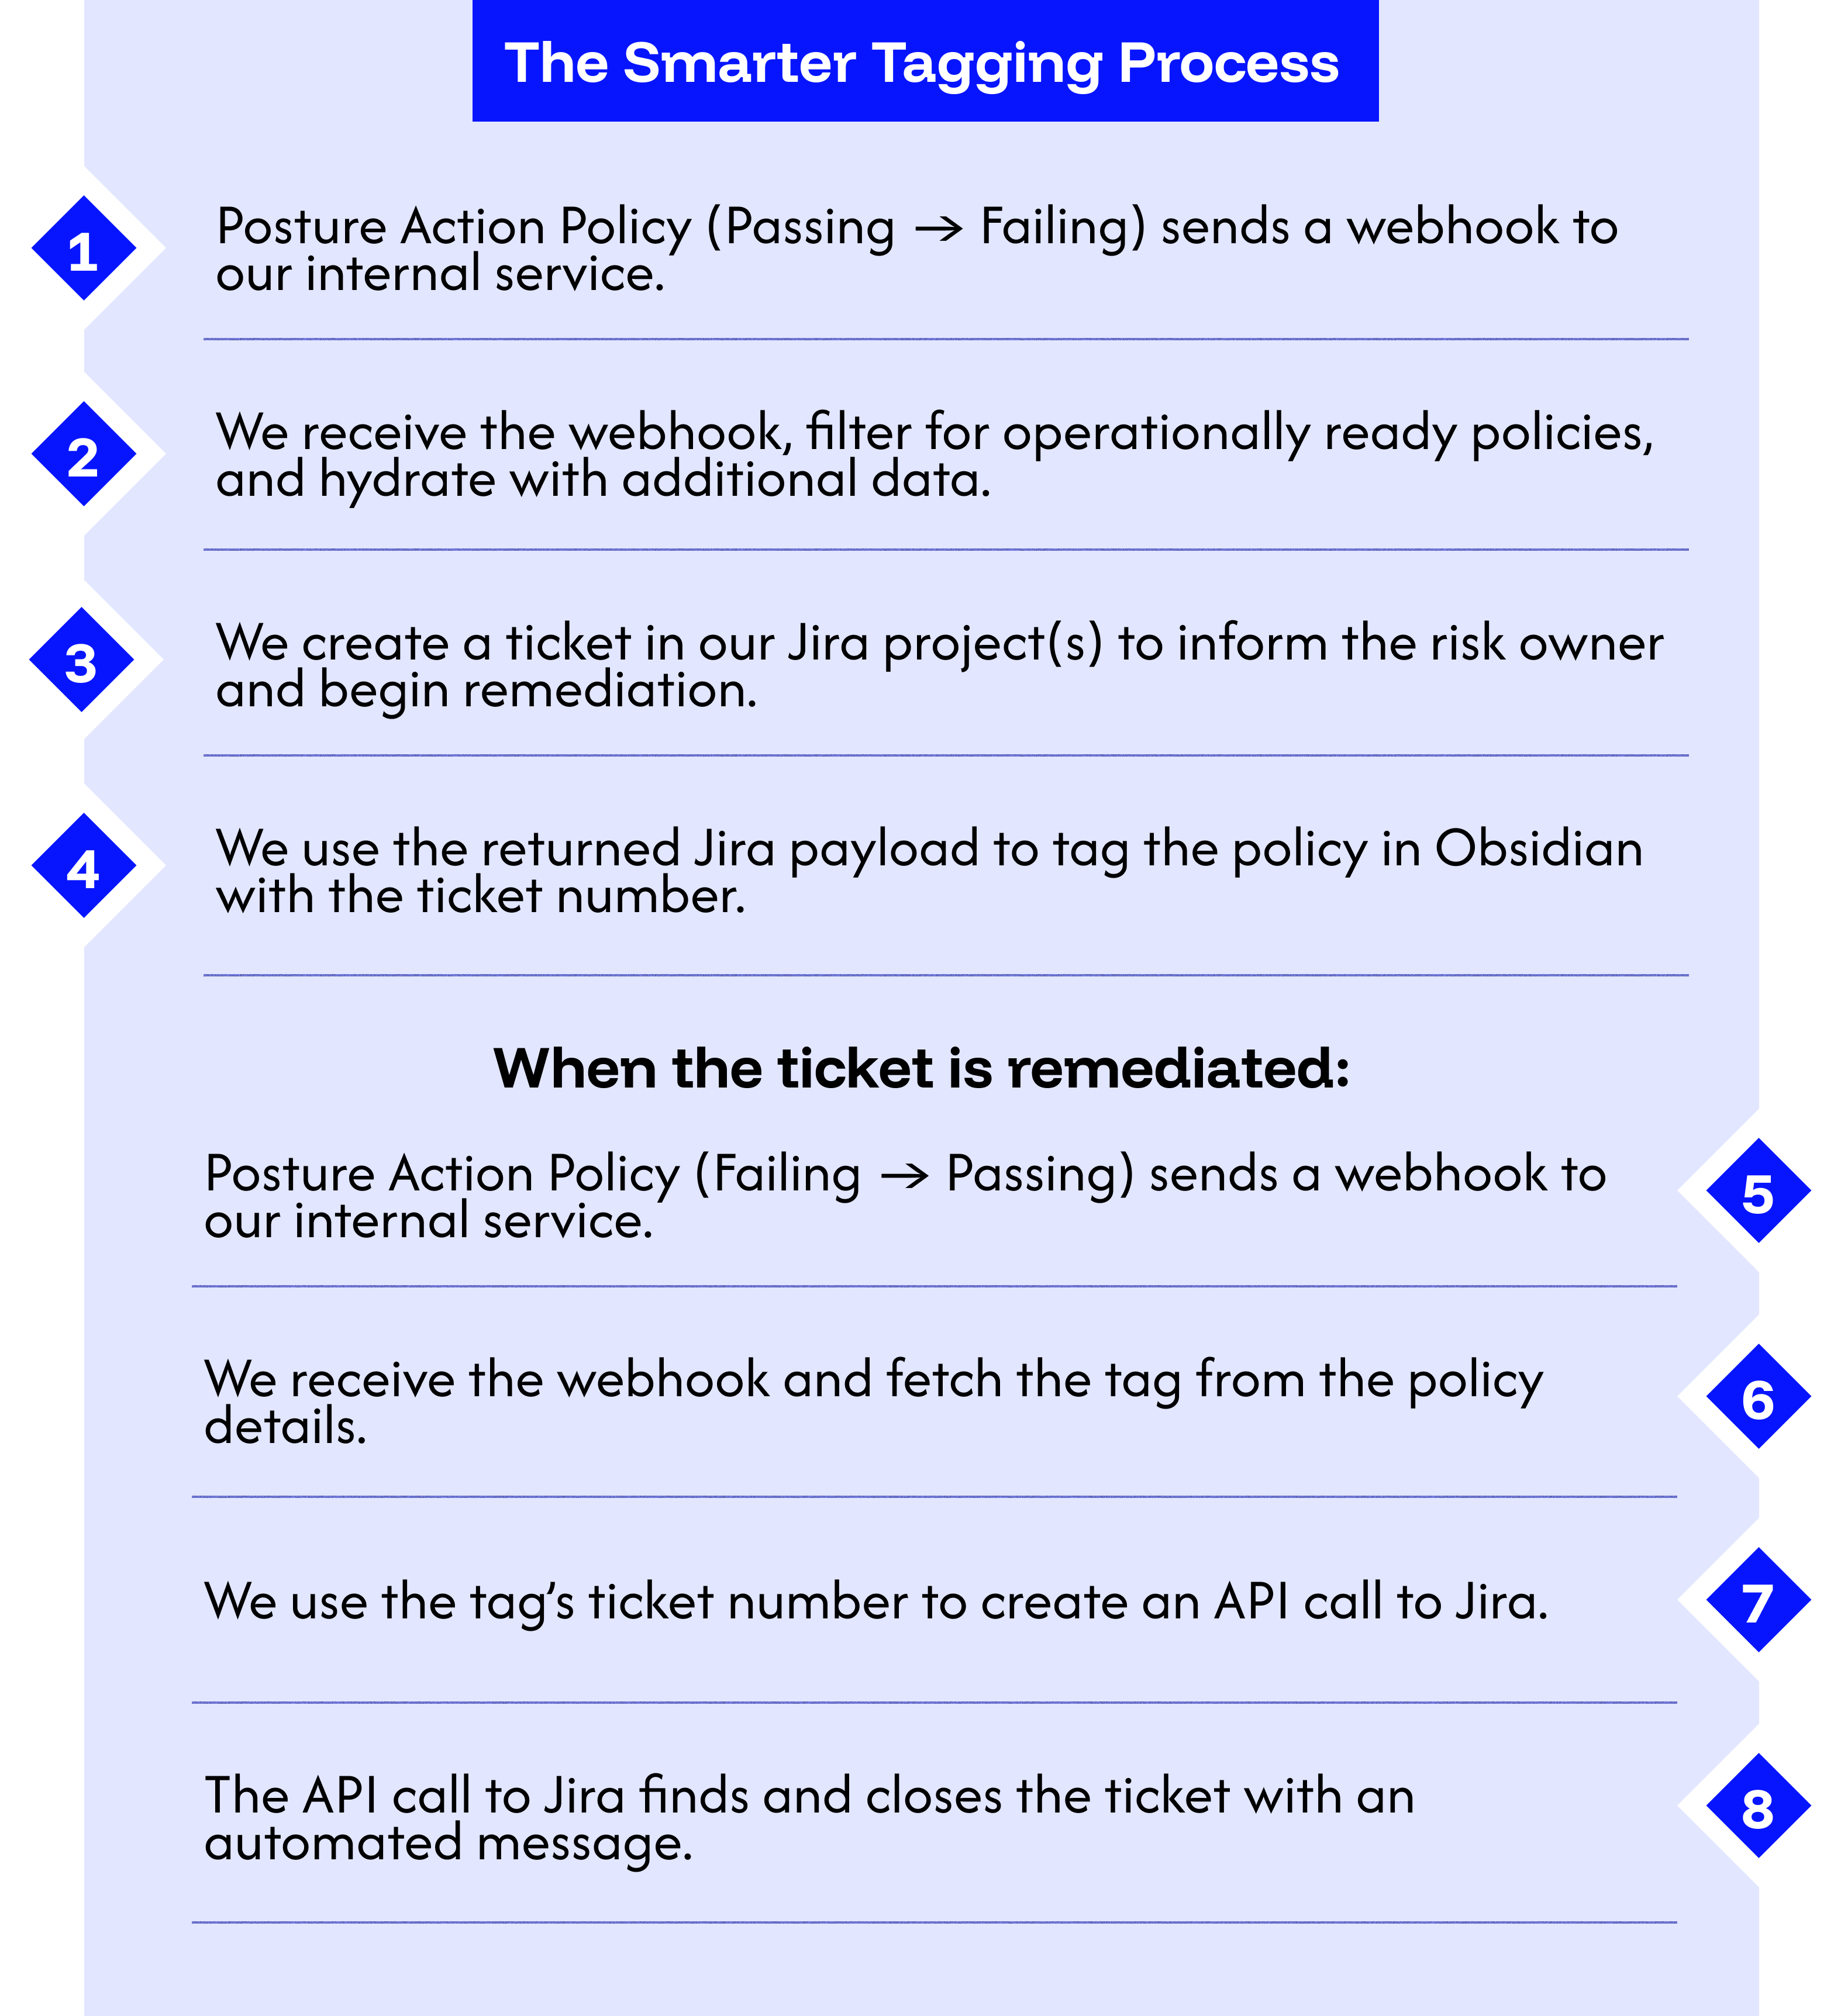
Smarter Tagging
To ensure a seamless ticket lifecycle, we leverage tags on all of our policies. The two primary use cases are 1) tags to signify operational readiness and 2) tags to facilitate ticket closure.
Tags that signify operational readiness are simple. We specify a string that is solely used to identify when a policy violation should result in a ticket (e.g. OPS-READY). This gives us batch capabilities for the work we do quarter over quarter and verifiable control over when tickets are created. New policies can be added to the Obsidian console without worry that it will disrupt the existing operational flow.
Tags to facilitate ticket closure are step 2 to streamlining the process and reducing human clicks. When an operationally ready policy (see the previous paragraph) does results in a created ticket, we receive a payload back from Jira with some information, namely the ticket ID (e.g. PROJ-12345). We attach a new tag to the same policy in Obsidian with this unique identifier. When a violation resolves, the payload sent over is used in a Jira lookup (using the tag) to ensure we close the correct ticket.
Looking Ahead
These automated services reflect a single philosophy: reduced clicks = reduced mental load.
By streamlining operational work, we free up our engineers to focus on what matters most: understanding and solving risks.
Next on our roadmap:
- Risk exceptions automation: Exporting Obsidian exceptions into Jira to embed accountability and escalation.
- Improved flexibility in our metrics and reporting: Exporting bulk data via API to a warehouse for extensible dashboarding.
For our company and team, automation isn’t just about fixing problems faster. It’s about empowering teams across the company to own risk, stay accountable, and move with agility. Obsidian gives us the foundation to do exactly that.